In today’s fast-paced world, it’s no more about keeping devices up-to-date; it’s about strengthening defenses and ensuring your prevention strategy is strong. As cyberattacks continue to evolve, measuring the success of your patch management process becomes more vital than ever.
Patch management is a process of remediating security risks once it’s detected and having a better insight into your network. But, in the chaos of managing infinite risks, you might often forget to measure the effectiveness of your patching efforts. Having patch management metrics to continuously evaluate and enhance the organization’s security posture is important.
Patch Management Metrics for 2024
When it comes to measuring the success of your patch management strategy, there are many KPIs you can compare with. But here are my top 7 patch management metric recommendations:
1. Patch Coverage Rate: This metric assesses the percentage of devices within your organization network that have received the latest patches. A high patch coverage rate indicates robust patch deployment practices, reducing the potential loopholes leading to a cyberattack.

2. Patch Compliance Rate: This metric measures the percentage of devices compliant with the organization’s patching policies and timelines. It reflects the adherence to security protocols and helps identify areas requiring improvement.

3. Patch Deployment Speed: This metric evaluates the time taken to deploy patches after their release. Faster deployment speeds reduce the window of vulnerability or exposure and keep your IT environment secure.
4. Patch Latency: Patch latency measures the time between patch availability and deployment on individual systems. It is always advised to remediate a risk as soon as the patch becomes available. Lower latency signifies an efficient patch management process and timely protection against emerging threats.
5. Patch Success Rate: This metric gauges the percentage of patches that are successfully deployed without causing system disruptions, compatibility issues, and disturbing operational hours. A high success rate indicates effective patch testing and deployment procedures.

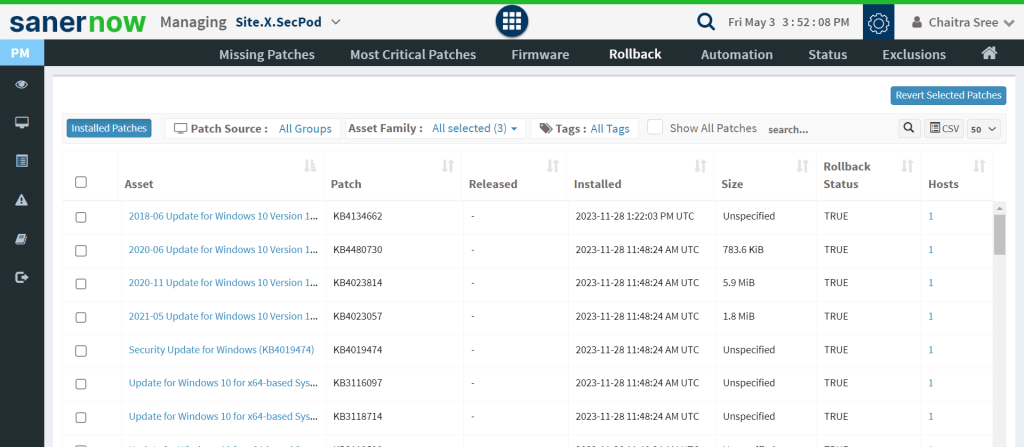
6. Patch Rollback Rate: In cases where patches cause system errors or issues, the patch rollback rate measures the percentage of patches that are rolled back or reverted. Alongside, monitoring this metric helps identify problematic patches and refine the testing process.

7. Vulnerability Reoccurrence Rate: This metric assesses the frequency at which previously patched vulnerabilities resurface. When we’ve applied a patch to fix a vulnerability, it’s crucial that it doesn’t show up again under any circumstances. A high reoccurrence rate could signal either poor patch management practices or ongoing security weaknesses.
Conclusion
By tracking the above patch management metrics, organizations can proactively identify vulnerabilities, improve their patch management strategy, and enhance the organization’s overall cybersecurity.
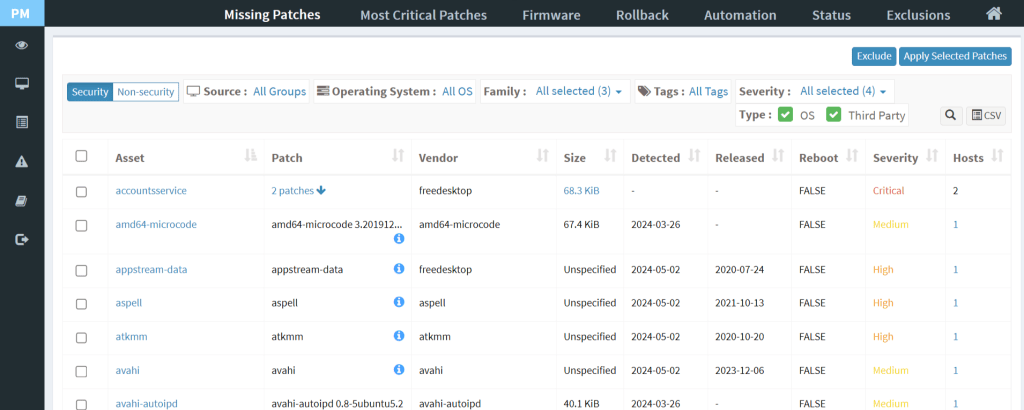
With SanerNow Patch Management, you can continuously manage all the patches, remediate within 24 hours, effortlessly roll back the patches, and have near zero false positives. It supports 450+ third-party applications and all major OS, including Windows, Linux, and macOS. Additionally, it supports the test and approve feature, which helps in testing the patches for any issues or errors before deployment in a productive environment.
Explore SanerNow Patch Management by scheduling a demo, or you can also start your free trial today.


